Note
Go to the end to download the full example code.
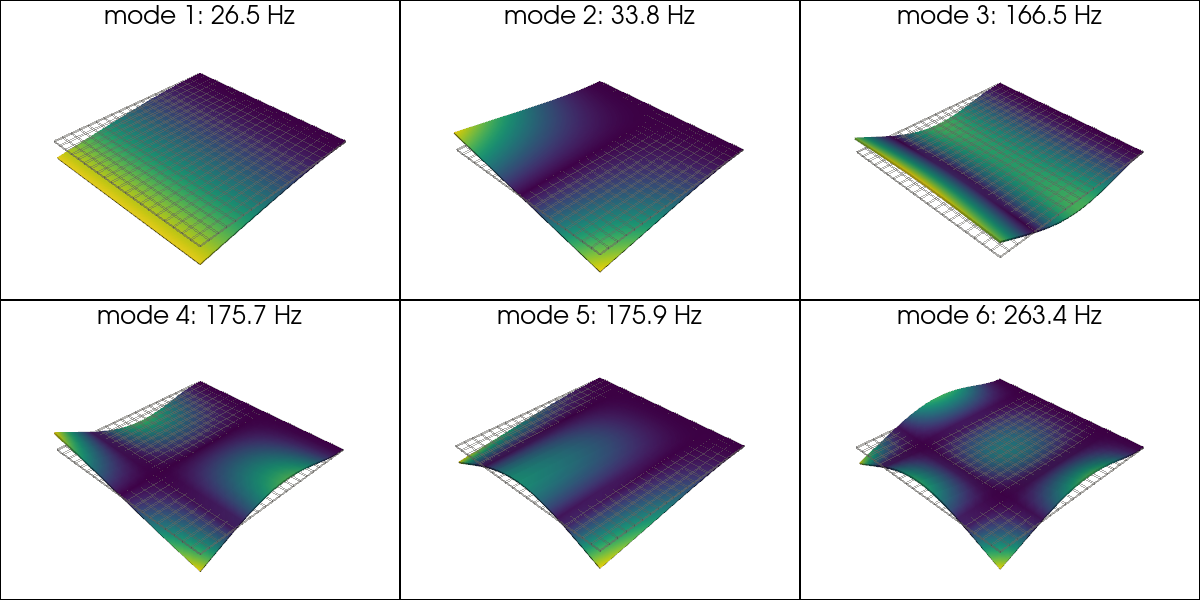
Plotting mode shapes#
A recipe for rendering the lowest few modes of a structure as a grid
of sub-plots. The key ingredients are
femorph_solver.io.modal_result_to_grid() (which scatters every
mode onto the mesh as a pyvista point-data array) and
pyvista.DataSet.warp_by_vector() (which deforms the mesh by the
mode shape scaled to a fixed fraction of the bounding box).
from __future__ import annotations

import numpy as np
import pyvista as pv

import femorph_solver
Build a quick cantilever plate + solve#
LX, LY, LZ = 1.0, 1.0, 0.01
grid = pv.StructuredGrid(
    *np.meshgrid(
        np.linspace(0.0, LX, 21),
        np.linspace(0.0, LY, 21),
        np.linspace(0.0, LZ, 3),
        indexing="ij",
    )
).cast_to_unstructured_grid()

m = femorph_solver.Model.from_grid(grid)
m.et(1, "SOLID185")
m.mp("EX", 1, 2.0e11)
m.mp("PRXY", 1, 0.30)
m.mp("DENS", 1, 7850.0)

pts = np.asarray(grid.points)
node_nums = np.asarray(grid.point_data["ansys_node_num"])
for nn in node_nums[pts[:, 0] < 1e-9]:
    m.d(int(nn), "ALL")

res = m.modal_solve(n_modes=6)
/home/runner/_work/solver/solver/examples/post-processing/example_mode_shape_plot.py:34: DeprecationWarning: Model.et(...) is a MAPDL-dialect shortcut and has moved off the Model public surface.  Use `APDL(model).et(et_id, name)` for line-by-line APDL deck porting, or the native `Model.assign("HEX8", material)` for new code.
  m.et(1, "SOLID185")
/home/runner/_work/solver/solver/examples/post-processing/example_mode_shape_plot.py:35: DeprecationWarning: Model.mp(...) is a MAPDL-dialect shortcut and has moved off the Model public surface.  Use `APDL(model).mp(prop, mat_id, value)` for line-by-line APDL deck porting, or the native `Model.assign(element, {prop: value, ...})` for new code.
  m.mp("EX", 1, 2.0e11)
/home/runner/_work/solver/solver/examples/post-processing/example_mode_shape_plot.py:36: DeprecationWarning: Model.mp(...) is a MAPDL-dialect shortcut and has moved off the Model public surface.  Use `APDL(model).mp(prop, mat_id, value)` for line-by-line APDL deck porting, or the native `Model.assign(element, {prop: value, ...})` for new code.
  m.mp("PRXY", 1, 0.30)
/home/runner/_work/solver/solver/examples/post-processing/example_mode_shape_plot.py:37: DeprecationWarning: Model.mp(...) is a MAPDL-dialect shortcut and has moved off the Model public surface.  Use `APDL(model).mp(prop, mat_id, value)` for line-by-line APDL deck porting, or the native `Model.assign(element, {prop: value, ...})` for new code.
  m.mp("DENS", 1, 7850.0)
/home/runner/_work/solver/solver/examples/post-processing/example_mode_shape_plot.py:42: DeprecationWarning: Model.d(...) is a MAPDL-dialect shortcut and has moved off the Model public surface.  Use `APDL(model).d(node, label, value)` for line-by-line APDL deck porting, or the native `Model.fix(nodes=..., where=..., dof=...)` for new code.
  m.d(int(nn), "ALL")
Attach every mode to the grid#
grid_plot = femorph_solver.io.modal_result_to_grid(m, res)
Render modes 1..6 in a 2 × 3 viewport grid#
plotter = pv.Plotter(shape=(2, 3), off_screen=True, window_size=(1200, 600))
for idx in range(6):
    row, col = divmod(idx, 3)
    plotter.subplot(row, col)
    phi_k = grid_plot.point_data[f"mode_{idx + 1}_disp"]
    factor = 0.1 / (np.max(np.abs(phi_k)) + 1e-30)
    plotter.add_mesh(grid_plot, style="wireframe", color="gray", opacity=0.3)
    plotter.add_mesh(
        grid_plot.warp_by_vector(f"mode_{idx + 1}_disp", factor=factor),
        scalars=f"mode_{idx + 1}_magnitude",
        cmap="viridis",
        show_scalar_bar=False,
    )
    plotter.add_text(
        f"mode {idx + 1}: {res.frequency[idx]:.1f} Hz",
        position="upper_edge",
        font_size=10,
    )
plotter.show()
Total running time of the script: (0 minutes 0.849 seconds)