Note
Go to the end to download the full example code.
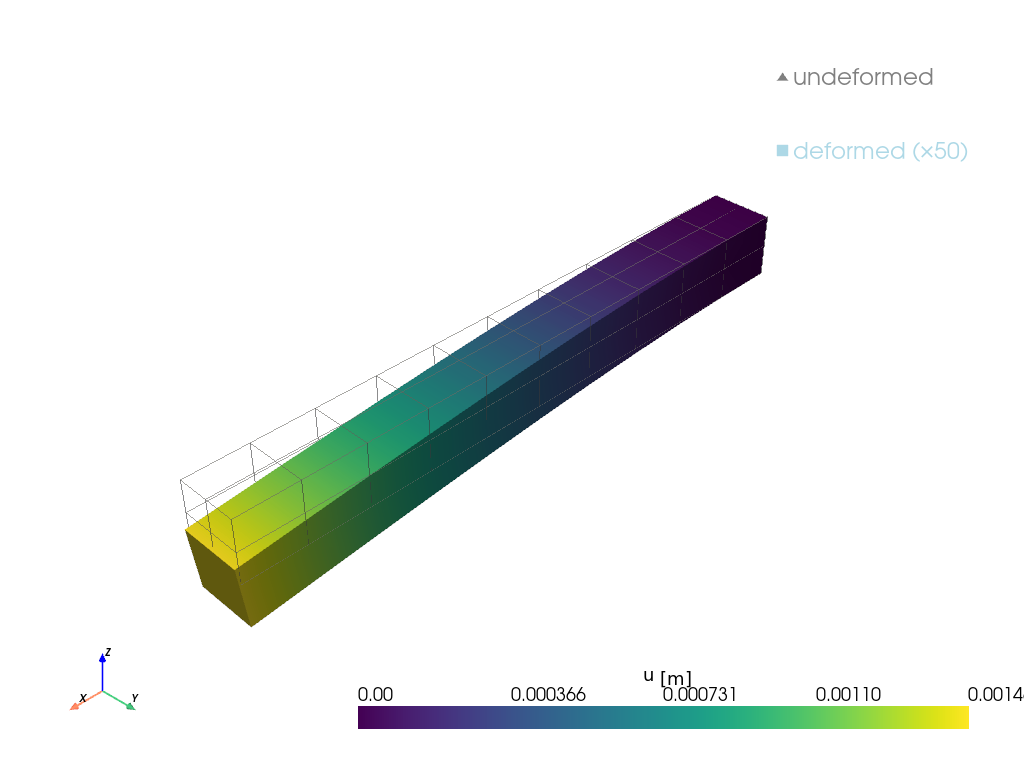
Static cantilever — first example#
A 60-second introduction to femorph-solver’s static analysis path: build a
steel cantilever beam as a structured pyvista grid, clamp the x=0
end, push the tip downward, and plot the deformed mesh.
from __future__ import annotations

import numpy as np
import pyvista as pv

import femorph_solver
Build a 10 × 2 × 2 hex cantilever#
Wrap as a femorph_solver.Model and stamp material#
Clamp the x=0 face, push the tip down#
pts = np.asarray(grid.points)
node_nums = np.asarray(grid.point_data["ansys_node_num"])
fixed = node_nums[pts[:, 0] < 1e-9]
for nn in fixed:
    m.d(int(nn), "ALL")

tip = node_nums[pts[:, 0] > LX - 1e-9]
for nn in tip:
    m.f(int(nn), "FZ", -10_000.0 / len(tip))
Solve#
res = m.solve()
print(f"Tip displacement (UZ) = {res.displacement[2::3][tip - 1].mean():.3e} m")
Tip displacement (UZ) = -1.458e-03 m
Plot the deformed shape#
deformed = femorph_solver.io.static_result_to_grid(m, res)
plotter = pv.Plotter(off_screen=True)
plotter.add_mesh(deformed, style="wireframe", color="gray", opacity=0.35, label="undeformed")
plotter.add_mesh(
    deformed.warp_by_vector("displacement", factor=50.0),
    scalars="displacement_magnitude",
    scalar_bar_args={"title": "|u| [m]"},
    label="deformed (×50)",
)
plotter.add_legend()
plotter.add_axes()
plotter.show()
Total running time of the script: (0 minutes 1.016 seconds)