Note
Go to the end to download the full example code.
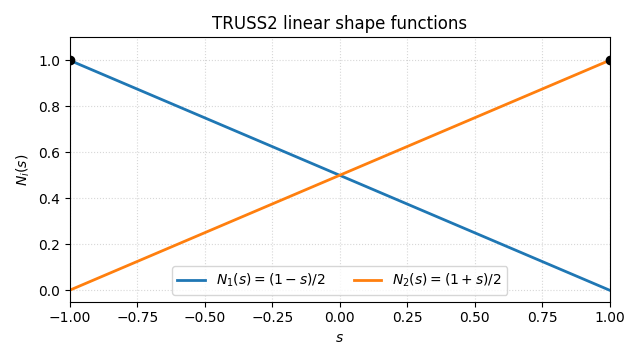
TRUSS2 reference geometry — linear axial bar#
The 2-node 3D truss (axial-only spar) maps to the natural coordinate \(s \in [-1, +1]\). Linear shape functions interpolate the three translational DOFs at each node:
Axial strain \(\varepsilon_{xx} = (u_2 - u_1) / L\) is constant across the element; the resulting 6×6 stiffness in the global frame is
with \((d_1, d_2, d_3)\) the unit direction cosines along the I→J axis.
References#
Cook, R. D., Malkus, D. S., Plesha, M. E., Witt, R. J. (2002) Concepts and Applications of Finite Element Analysis, 4th ed., Wiley, §3.2.
Bathe, K.-J. (2014) Finite Element Procedures, 2nd ed., Prentice Hall, §5.3.1.
Przemieniecki, J. S. (1968) Theory of Matrix Structural Analysis, McGraw-Hill, §5.1.
Implementation: femorph_solver.elements.truss2.Truss2.
from __future__ import annotations

import matplotlib.pyplot as plt
import numpy as np
import pyvista as pv
Linear shape functions on [-1, +1]
s = np.linspace(-1.0, 1.0, 200)
N1 = 0.5 * (1.0 - s)
N2 = 0.5 * (1.0 + s)

fig, ax = plt.subplots(1, 1, figsize=(6.4, 3.6))
ax.plot(s, N1, label="$N_1(s) = (1 - s) / 2$", color="#1f77b4", lw=2)
ax.plot(s, N2, label="$N_2(s) = (1 + s) / 2$", color="#ff7f0e", lw=2)
ax.scatter([-1.0, 1.0], [1.0, 1.0], color="black", zorder=5)
ax.set_xlabel(r"$s$")
ax.set_ylabel("$N_i(s)$")
ax.set_title("TRUSS2 linear shape functions")
ax.legend(loc="lower center", ncol=2, fontsize=10)
ax.grid(True, ls=":", alpha=0.5)
ax.set_xlim(-1.0, 1.0)
ax.set_ylim(-0.05, 1.1)
fig.tight_layout()
fig.show()
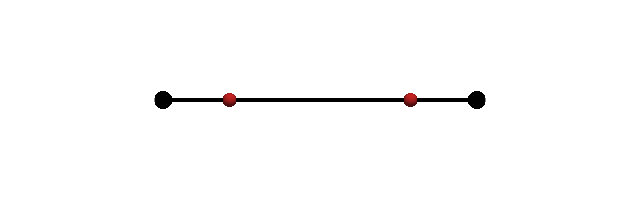
Reference element with the 2-point Gauss-Legendre rule
cells = np.array([2, 0, 1])
cell_types = np.array([pv.CellType.LINE], dtype=np.uint8)
truss = pv.UnstructuredGrid(cells, cell_types, np.array([[-1.0, 0.0, 0.0], [+1.0, 0.0, 0.0]]))
g = 1.0 / np.sqrt(3.0)
gauss = np.array([[-g, 0.0, 0.0], [+g, 0.0, 0.0]])

plotter = pv.Plotter(off_screen=True, window_size=(640, 200))
plotter.add_mesh(truss, color="black", line_width=4)
plotter.add_points(
    np.array([[-1.0, 0.0, 0.0], [+1.0, 0.0, 0.0]]),
    render_points_as_spheres=True,
    point_size=18,
    color="black",
    label="end nodes",
)
plotter.add_points(
    gauss,
    render_points_as_spheres=True,
    point_size=14,
    color="#d62728",
    label="2-pt Gauss-Legendre",
)
plotter.view_xy()
plotter.camera.zoom(1.6)
plotter.show()
Sanity — partition of unity at every Gauss point
sums = N1[np.searchsorted(s, [-g, +g])] + N2[np.searchsorted(s, [-g, +g])]
np.testing.assert_allclose(sums, 1.0, atol=1e-12)
print("OK — N_1(s) + N_2(s) = 1 at every Gauss point.")
OK — N_1(s) + N_2(s) = 1 at every Gauss point.
Total running time of the script: (0 minutes 0.258 seconds)